Master the skills to analyze business data, create impactful dashboards, and drive data-informed decisions for organizational success.
1 instructor teaches this course
48
menu_book
Classes & activities
Starts at
₹1,11,669Inclusive of GST
What you'll be able to do after completing these classes
done
Analyze business data to extract actionable insights and support strategic decisions.
done
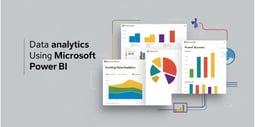
Design and build professional dashboards and reports using industry-standard tools.
done
Apply data-driven approaches to solve business problems and communicate findings effectively.
Classes and Activities
person_outline
Course Introduction & Data Analytics Overview
1 hr 30 min
expand_more
Meet your instructor and peers, review the course structure, and discuss the role of data analytics and business intelligence in modern organizations. Understand key concepts and career paths.
person_outline
Python Setup and Environment Basics
1 hr 30 min
expand_more
Learn how to install Python, Jupyter Notebook, and essential libraries. Set up your workspace and get familiar with the tools you'll use throughout the course.
person_outline
Python Fundamentals: Variables, Data Types, and Operators
1 hr 30 min
expand_more
Dive into Python syntax, variables, data types (strings, numbers, lists, dictionaries), and operators. Practice writing and running simple Python scripts.
person_outline
Control Flow in Python: Conditionals and Loops
1 hr 30 min
expand_more
Explore if-else statements, for and while loops, and logical operators in Python. Apply control flow to automate repetitive tasks in data analysis.
person_outline
Functions and Modules in Python
1 hr 30 min
expand_more
Understand how to define and use functions, import modules, and organize your Python code for data analysis projects.
person_outline
Introduction to Pandas for Data Analysis
1 hr 30 min
expand_more
Learn the basics of the Pandas library, including Series and DataFrames. Practice loading, inspecting, and manipulating data.
person_outline
Data Cleaning with Pandas
1 hr 30 min
expand_more
Handle missing values, duplicates, and inconsistent data. Learn best practices for preparing data for analysis using Pandas.
person_outline
Data Aggregation and Grouping in Pandas
1 hr 30 min
expand_more
Use groupby, aggregation, and pivot tables to summarize and analyze datasets efficiently in Pandas.
person_outline
Basic Data Visualization in Python
1 hr 30 min
expand_more
Create basic plots such as line, bar, and scatter plots using Matplotlib and Seaborn. Learn to interpret visualizations for insights.
person_outline
Advanced Data Visualization in Python
1 hr 30 min
expand_more
Create complex visualizations like heatmaps and pairplots. Customize plots for effective data storytelling.
About the course
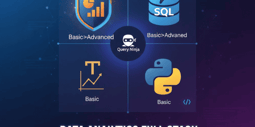
This 12-week instructor-led course equips participants with the essential skills to analyze business data, build professional dashboards, and generate insightful reports. Through hands-on projects and real-world case studies, learners will master industry-standard tools and techniques to support business decisions with data-driven insights. The course prepares you for in-demand roles such as Data Analyst, Business Analyst, BI Analyst, Reporting Analyst, Data Visualization Specialist, and Analytics Consultant.
Availability
1 enrollment options available
Jun 21 (Sun)
7:00 AM
computer
Mon
Tue
Wed
Thu
Fri
Sat
Sun
Yuno Learning
About the academy
Founded 2014 in Reston, VA, Ingress is an SBA-certified IT firm with 10 years in federal, financial & healthcare delivery. With in-house AI arm Otonmi, we unite strategy + delivery under one team using the Aizen model for cloud modernization, data engineering & AI.