video
Excel: PMT & FV Functions
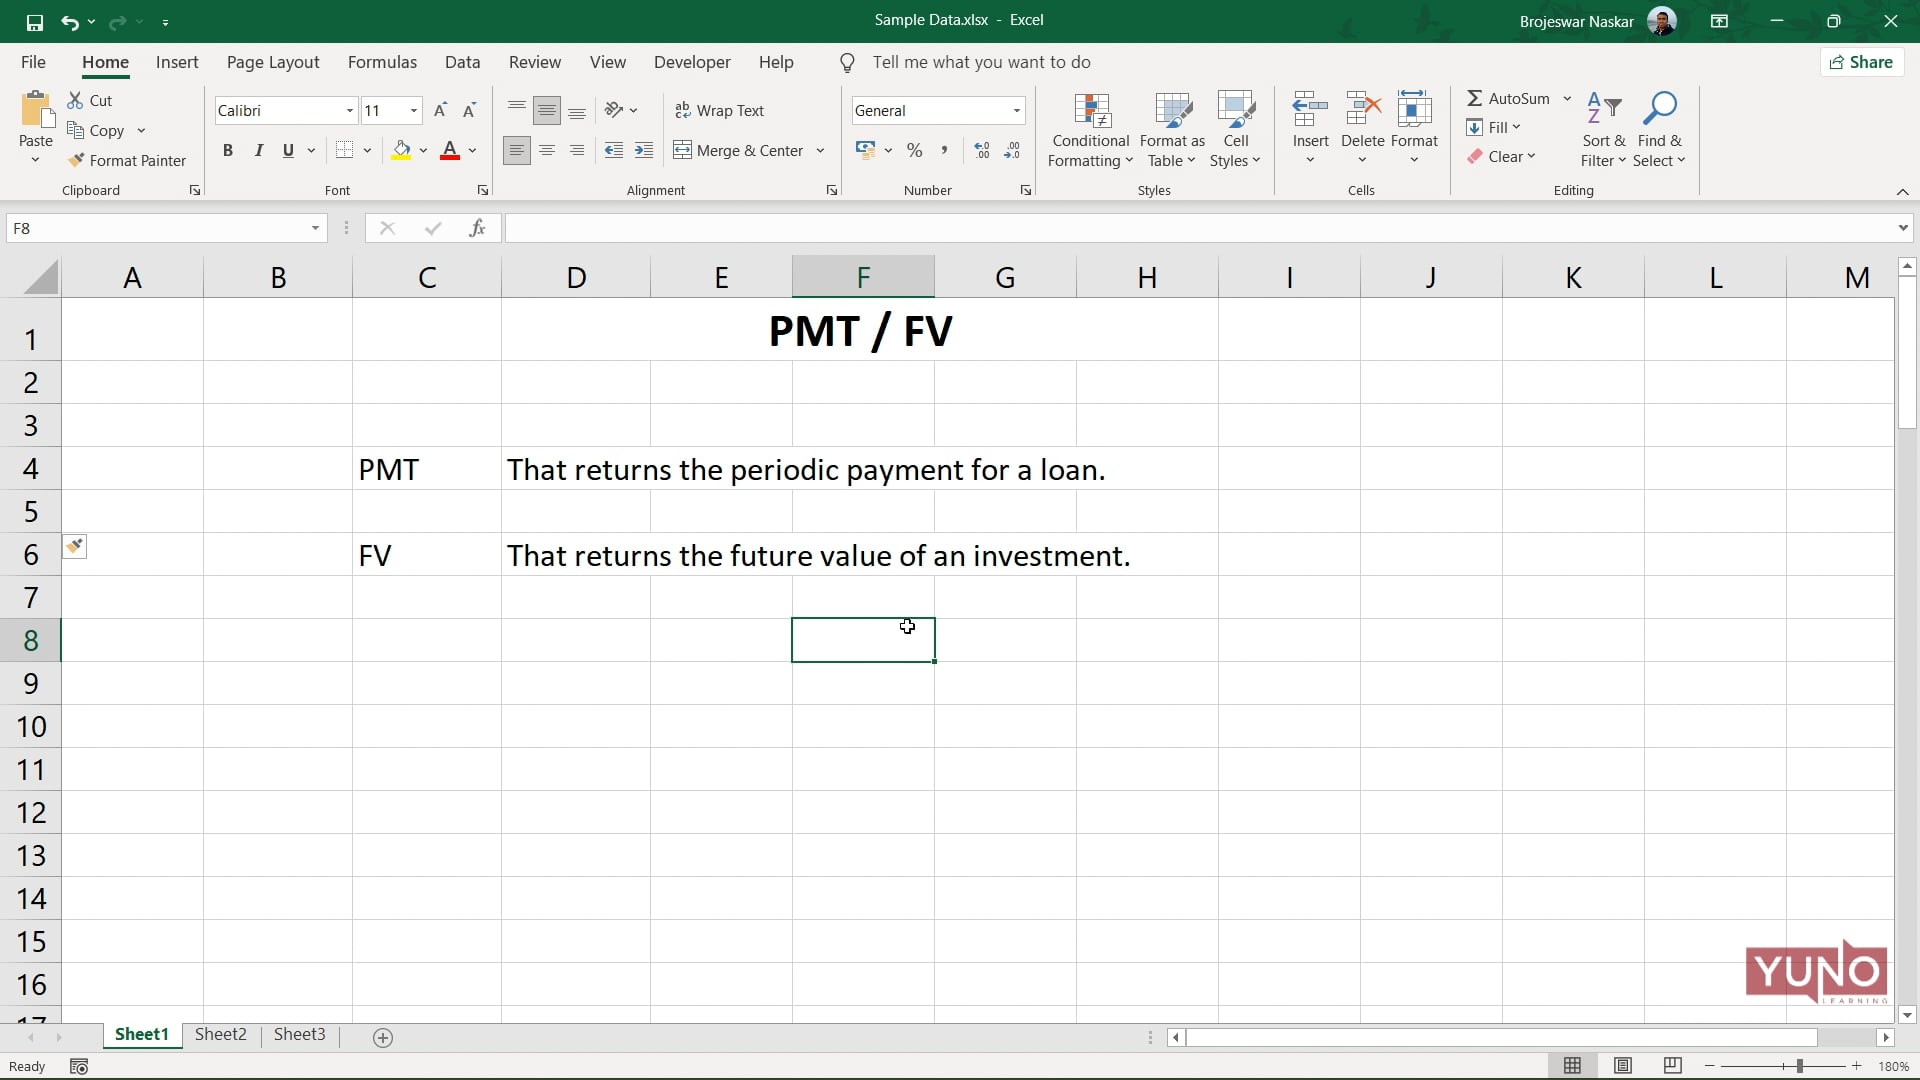
PMT function is a financial function that returns the periodic payment for a loan. FV function returns the future value of an investment.
Microsoft Excel is considered as one of the most useful tools by many people, all thanks to its list of benefits and an array of formulas and functions. No matter for what purpose you are using Excel, you will come across all the formulas that will help you arrange and manage your data in the most efficient manner.
This collection page targets the Financial functions in Excel which are commonly used for performing various calculations in Business organizations. Some of the functions that we have covered here include PMT, FV, Goal Seek Tool, Scenario Manager and Data Table in Excel
Not only that, you will also learn how you can use these formulas in real life through the help of various video tutorials. So continue reading!
PMT function is a financial function that returns the periodic payment for a loan. You can use the PMT function to figure out payments for a loan, given the loan amount, number of periods, and interest rate. The PMT function can be used to figure out the future payments for a loan, assuming constant payments and a constant interest rate.
For example, if you are borrowing $5,000 on a 24 month loan with an annual interest rate of 8 percent. PMT can tell you what your monthly payments are and how much principal and interest you are paying each month. Be sure you are consistent with the units you supply for rate and nper.
If you make monthly payments on a three-year loan at an annual interest rate of 12 percent, use 12%/12 for rate and 3*12 for nper. For annual payments on the same loan, use 12 percent for rate and 3 for nper. The payment returned by PMT includes principal and interest but will not include any taxes, reserve payments, or fees.
FV function is a financial function that returns the future value of an investment. You can use the FV function to get the future value of an investment assuming periodic, constant payments with a constant interest rate.
The future value (FV) function calculates the future value of an investment assuming periodic, constant payments with a constant interest rate. If pmt is for cash out (i.e deposits to savings, etc), payment value must be negative; for cash received (income, dividends), payment value must be positive. Units for rate and nper must be consistent.
For example, if you make monthly payments on a four-year loan at 12 percent annual interest, use 12%/12 (annual rate/12= monthly interest rate) for rate and 4*12 (48 payments total) for nper. If you make annual payments on the same loan, use 12% (annual interest) for rate and 4 (4 payments total) for nper.
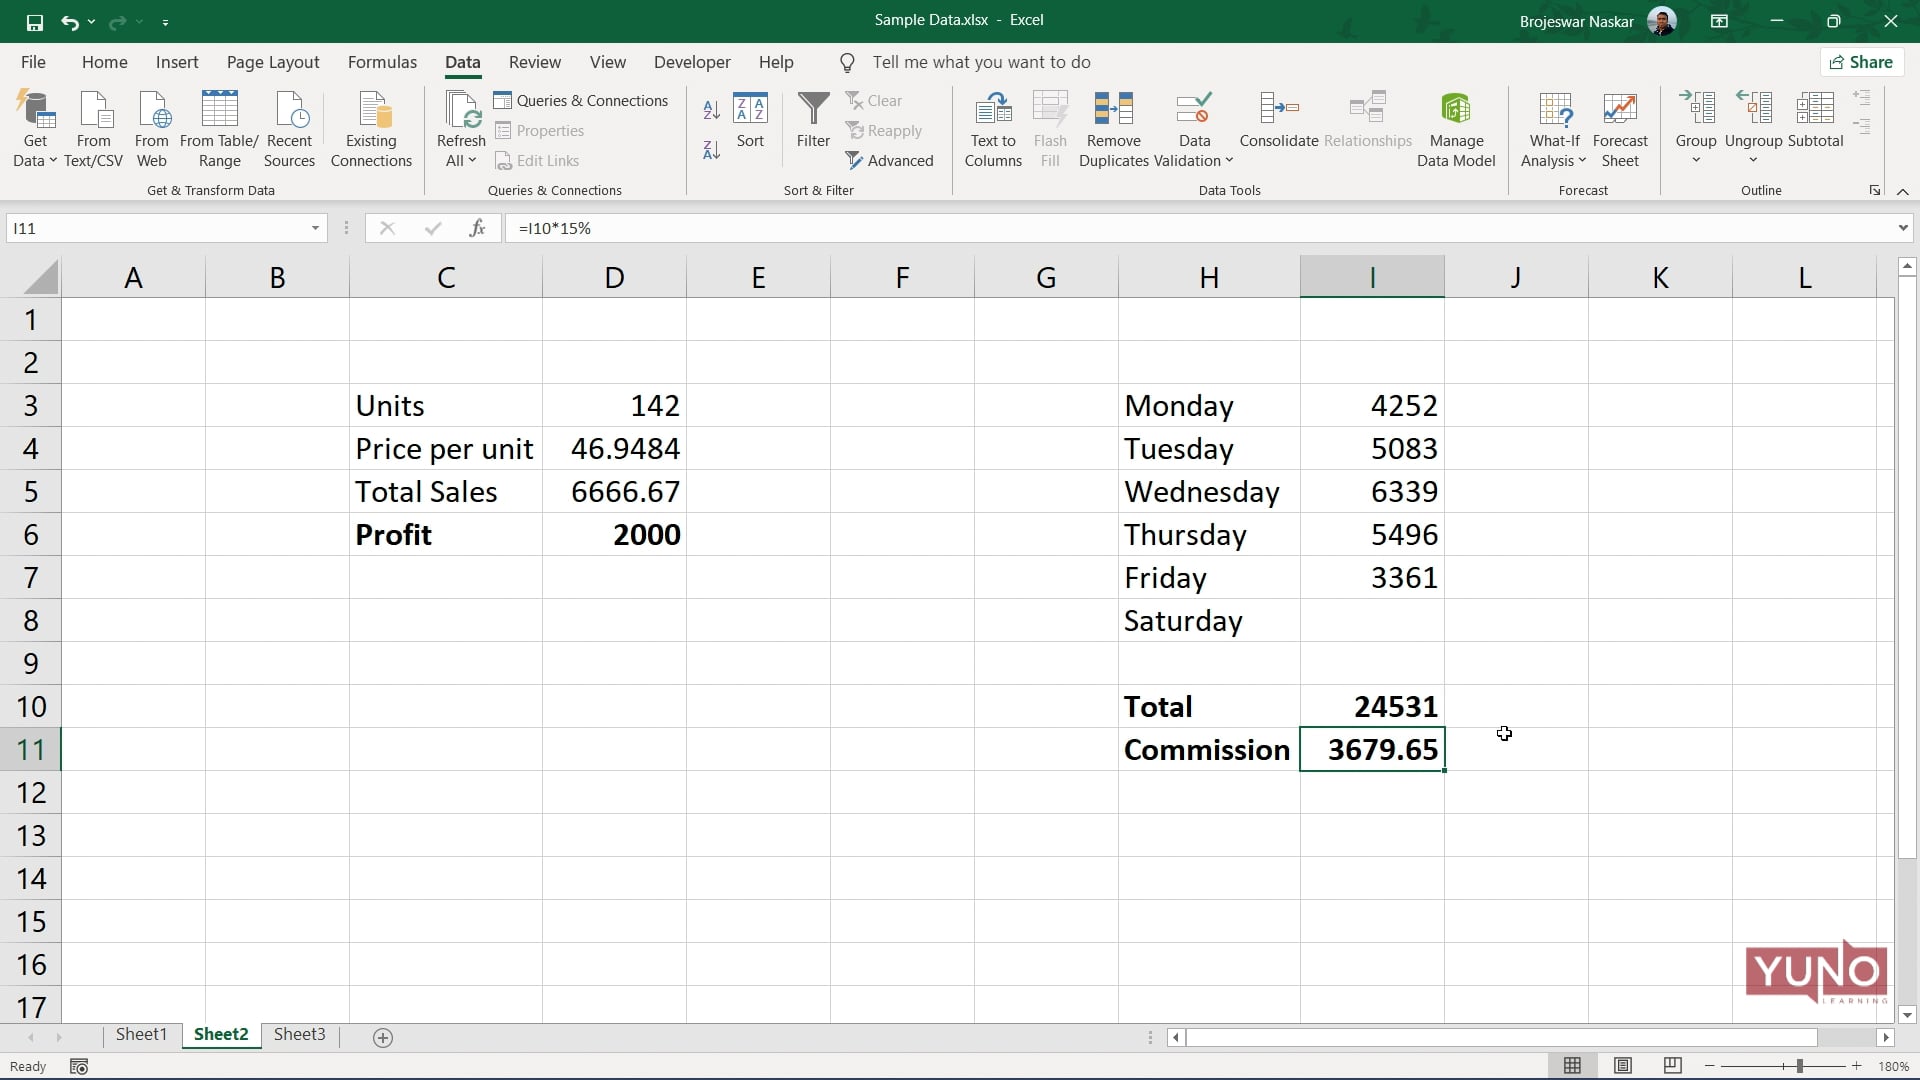
Goal Seek is a what-if analysis tool that helps you to find the input value that results in a target value that you want. Goal Seek requires a formula that uses the input value to give the result in the target value. Then, by varying the input value in the formula, Goal Seek tries to arrive at a solution for the input value.
For example, the cost price of a product is $15 and the business wants to earn revenue of $50,000. The Goal Seek function can determine the number of units of the product to be sold to achieve the given target of $50,000. The Goal Seek changes the variable to study the variations in the result. It shows the impact of change in one value on the other value. This is why it is helpful in cause and effect analysis.
This function instantly calculates the output when the value is changed in the cell. You have to mention the result you want the formula to generate and then determine the set of input values that will generate the result.
For example, a company is suffering a loss of 13.8 lacs. It is identified that the maximum price for which a generator can be sold is Rs. 18000. It is required to identify the number of generators that can be sold, which will return the break-even value (No Profit No Loss). So the Profit value (Revenue - Fixed Cost + Variable cost) needs to be zero to attain break-even value.
Scenario Manager is useful in the cases where you have more than two variables in sensitivity analysis. Scenario Manager creates scenarios for each set of the input values for the variables under consideration. Scenarios help you to explore a set of possible outcomes. If you want to analyze more than 32 input sets, and the values represent only one or two variables, you can use Data Tables. Although it is limited to only one or two variables, a Data Table can include as many different input values as you want.
For example, you can have several different budget scenarios that compare various possible income levels and expenses. You can also have different loan scenarios from different sources that compare various possible interest rates and loan tenures. If the information that you want to use in scenarios is from different sources, you can collect the information in separate workbooks, and then merge the scenarios from the different workbooks into one.
A scenario is a set of input values that you can substitute in a worksheet to perform what if analysis. You could also create scenarios to show various interest rates, loan amounts, and terms for a mortgage. Excel's scenario manager lets you create and store different scenarios in the same worksheet.
Sometimes one answer isn't enough. Occasionally, you need to see multiple possibilities. When this happens, consider adding a data table to your sheet. A data table is a range that evaluates changing variables in a single formula. In other words, it's a simple what-if analysis: How does changing an input value change the results? Instead of viewing multiple sheets, you can examine the possibilities with a quick glance at one data table.
In Microsoft Excel, a data table is one of the What-If Analysis tools that allows you to try out different input values for formulas and see how changes in those values affect the formulas output. Data Tables are, especially, useful when a formula depends on several values, and you'd like to experiment with different combinations of inputs and compare the results.
Currently, there exists one variable data table and two variable data tables. Although limited to a maximum of two different input cells, a data table enables you to test as many variable values as you want. One variable data table in Excel allows testing a series of values for a single input cell and shows how those values influence the result of a related formula. To help you better understand this feature, we are going to follow a specific example rather than describing generic steps.
To learn more about advanced excel topics, login to www.yunolearning.com. We also offer courses in Spoken English, Business Writing and IELTS preparation. Send us your inquiries at maya@yunolearning.com or call at +91-8847251466.