article
IELTS Diagram Report With Sample Answer
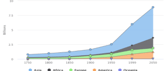
The above diagram shows the historic and estimated world population growth by region. Summarize the information by selecting and reporting.
In IELTS Academic Writing Task 1, you should be able to summarise the information presented to you in the form of a graph (bar/line), pie chart, table or process. You are required to write a summary of at least 150 words.
Bar graphs are also known as bar charts. Like line graphs they also have two axes and are useful for showing how something has changed over a given period of time. How to write this task? Divide your IELTS writing Task 1 into different paragraphs to make your response well-structured and logical. Paragraphing makes your writing more organised.
This collection page is a compilation of questions that appeared in the real IELTS exams. You can practice these questions on your own to score a good band in your IELTS Writing Task 1 Chart question.
Q1 The below diagram shows the historic and estimated world population growth by region. Summarize the information by selecting and reporting the main features. Write at least 150 words.
Sample Answer:
The given chart illustrates both the historic and the predicted growth of population in five regions of the world, namely, Asia, Africa, America, Europe and Oceania from 1750 to 2050. The population is depicted in billions.

Overall, the population has grown in all the regions except Oceania, and is expected to rise even in the future. However, it is predicted that Asia will continue to be the most inhabited, whereas Oceania will remain the same.
In 1750, America, like Oceania, did not have any population whereas Asia had around 0.5 billion. The habitation of America started only in 1850. Both these regions started showing an upward trend after 1950, and in both, the population has been steadily increasing since then. It is predicted that by 2050, the population of Asia and America will have become around 5 and 1.25 billion respectively.
Comparatively, both Europe and Africa together had just around 0.5 billion population in 1750. Although in Europe, it increased steadily, Africa did not have an upward trend till 1950. However, it is predicted that by 2050, the population in Africa will have grown to about 2 billion, equivalent to that of both Europe and America.
Q2 Summarize the information given in the graph in 150 words or less.
Sample Answer:
The given combination chart compares mean figures for temperature and rainfall over the course of a calendar year in Tokyo. The temperature is measured in degree celsius and the rainfall is measured in millimetres. The source of information is worldclimate.com.
It is noticeable that the monthly figures for precipitation in Tokyo vary and fluctuate considerably throughout the year. In comparison, the monthly temperature shows an upward trend during the first half, followed by a downside in the second half of the year. Both reach their peak in different months.
Rainfall is the highest in September, while temperature is at its peak in August. Between the months of January and August, the average temperature in Tokyo rises from its lowest point of around 7°C to a peak of over 26°C. Similarly, average rainfall in the city also rises between January and June, from approximately 50 mm of rain in January to 170mm in June. But shows a considerable fall in July before reaching its peak in September.
The final three months of the year see a dramatic fall in precipitation, to a low of about 60 mm in December, and a steady drop in temperature which falls to around 10°C, nearly back to the March average.
Q3 The chart below gives information about the high-speed continuous internet connection of households in five countries in 2001 and 2002.

Sample Answer:
The table and bar charts compare five countries based on the high-speed internet connection owned by families. The data is represented as the number of connections per thousand households in two consecutive years, namely 2001 and 2002.
Overall, it is seen that the use of the internet was more widespread in the USA and South Korea as compared to European countries. However, the highest growth in usage was observed in Britain.
In comparison, internet usage in Germany, Switzerland, and Britain was negligible with barely .35% of households having a high-speed connection in each of these countries. However, the numbers for Great Britain skyrocketed to 1.08% as a result of the 230% proliferation. In comparison, Germany and Switzerland, with a change of 80% and 120% respectively, had .56% and 79% of families with good quality internet connectivity in 2002.
In 2001, 12.2% of South Korean families had access to high-speed, uninterrupted internet as compared to 9.3% in the US. Conversely, in 2002, with a growth of 170%, the numbers in the USA had surged to 25.11% while South Korea experienced a negligible change of 20% resulting in 13.44% of households with internet connectivity.
Q4 The chart below gives information about the age of women in Australia when they gave birth to their first child in 1966, 1986 and 2006. Summarise the information by selecting and reporting the main features and make comparisons where relevant.

Sample Answer:
The bar chart represents age-wise data of Australian women delivering their first child, in percentages, in 1966, 1986, and 2006.
It is evident from the chart that in the earlier decades, a higher percentage of women had their first child in their twenties, but with the passage of time, the proportion increased considerably for women in their thirties.
On the other hand, women aged 30-34 and 34-39 birthing their first child rose significantly from around 12% and 8% in 1966 to almost 45% and 30% respectively in 2006. In comparison, women aged 40+ were an insignificant minority at around 2% and 4% in 1966 and 2006 respectively.
In 1966, most deliveries ie. around 60% happened when women were aged 19-24. This number dropped significantly to about 35% in 1986; by 2006 it was less than 30%. Likewise, more than 30% of teenagers became mothers in 1966, but by 2006, this proportion had dropped by more than half to approximately 11%. In comparison, the 25-30 age group showed a fluctuating trend with the proportion of women having their first child increasing sharply from around 35% in 1966 to 50% in 1986 and then decreasing marginally to approximately 39% in 2006.
Q5 The line chart details birth rates for the United States and China from 1920 to 2000. Summarise the information below.

Sample Answer:
The data in the line chart depicts the birth rate of the US and Chins, from 1920 to 2000, it is clearly seen that birth rates in both nations followed similar declining trends over the period with a few exceptions in the first half of the century.
In 1920, the birth rate in China was 10%, and it followed a fluctuating trend till 1930. However, between 1930 and 1935, the Chinese birth rate surged to touch 15% and by 1940, it plunged to 5%. The rate remained stable at 5% for 5 years post which it skyrocketed to 20% by 1955 only to dip drastically to around 8% by 1960. Post this, the birth rate in China continued to fall steadily to reach an all-time low of 2% by 2000.
Comparatively, the US started with a birth rate of 11% in 1920 which fluctuated till 1940, fell to 7% by 1945 and then doubled to around 14% by 1950. Subsequently. Just like China, the US birth rate witnessed a steady decline and was approximately 7% in 2000. The US birth rate was higher than that of China in all the years barring 1935 and 1950.
In fact, post-1960, the US birth rate remained higher than that of China with a steady gap of around 5%, till 2000.
Q6 The charts below show the number of people in Europe who were affected by four types of noise by day and by night in cities and rural areas in 2007.


Sample Answer:
The bar charts give details of Europeans impacted by noise from four sources, with a breakup for rural and urban areas, by day and by night
The statistics clearly indicate that traffic was the major contributor to noise pollution, in both urban and rural areas, irrespective of the time of the day. Moreover, city dwellers were more impacted by noise as compared to inhabitants of rural areas
Noise generated by traffic impacted 64 million city residents in the daytime and exactly 75% of that number ie 48 million people at night. Comparatively, in the villages, the numbers were around half that in the cities with 34 million and 24 million residents being affected by traffic noise. On the other hand, noise emanating from industries had no impact in the rural areas and even in the cities, a minuscule 1 million and 25 million city dwellers felt its effect during the day and at night, respectively.
The sound of trains had repercussions on 10 million and 8 million city people by day and night respectively whereas the numbers were 8 million and 6 million respectively in the countryside. Barring industries, airplanes had the least impact with 4 million and 2 million people in cities and villages respectively, in the daytime, and 1 million each, in cities and the rural areas being impacted by their noise.
Q7 The charts below show the number of males, females, and total Olympic participants who participated in the Olympics from 1924 to 2014. Summarise the information by selecting and reporting the main features, and make comparisons where relevant.

Sample Answer:
The bar chart illustrates information about Olympic participants by gender, every 30 years, from 1924 to 2014 whereas, the line graph gives details of the total number of participants during the same period for female participants
The line graph clearly indicates a steady growth in the total number of participants over the given period Likewise, the bar chart reveals growth in participants for both genders.
However, the growth is more significant with respect to overall participation in the Olympics, the numbers were around 3000 in 1924. This kept steadily increasing over the years and finally reached a little over 10,000 in 2014
A closer look at the bar graph reveals that there was a huge gender gap with over 3000 men and just about 100 women participating in the 1924 Olympics. This number increased significantly for men and reached around 4400 whereas for women the numbers doubled to around 400 by 1954. While a steady rise ensured that the total number of male participants touched close to 5800 by 2014, female participation grew by leaps and bounds to reach almost 5000 in the same period. Thus, the gap between male and female Olympic participants had reduced significantly by 2014.
Q8 The line graph shows the percentage of different age groups of cinema visitors in a particular country from 1978 to 2008.

Sample Answer:
The line graph gives information, in percentages, about movie theatre-goers in a specific country between 1978 and 2008.
It is clear from the graph that the percentage of cinema goers was inversely proportional to their ages.
In 1978, the highest percentage of cinema visitors at 90% was in the lowest age group ie. 18-24 whereas the oldest people aged 50+ had only 40% cinema-goers. By 1988, this number had declined by 20% for those aged 25 to 50+ while the drop was around 18% in the 14-24 age group. Conversely the percentage of cinema goers rose in the next decade. It was around 20% for all groups except the 25 34 age group for which it was 10%
Subsequently, in the next 5 years, till 2003, the numbers plateaued across all ages. However, by 2008, the percentage of cinema visitors had dropped by an average of 10% for people aged 14 to 49. Despite this drop the highest percentage of cinema goers of 80% was still in the 14-24 age group, followed by 65% in the 25-34 age group Comparatively, the 50+ age group was the only group which showed an increase despite which, it shared the lowest position along with the 35 49 age group with 50% moviegoers.
Q9 The graph below shows the annual visitor spend for visitors to New Zealand from 5 countries: for the years 1996 to 2014. Summarise the information by selecting and reporting the main features, and make comparisons where relevant.

Sample Answer:
The line graph illustrates the amount of money, in New Zealand dollars, spent by tourists from five different countries visiting New Zealand between 1996 and 2014. The countries considered are Australia, the USA, the UK, Japan and China.
It is quite apparent that tourist spending increased over the period although there were fluctuations along the way. The increase was highest for Australia whereas it was negligible for Japan.
In 1996, Chinese tourists to New Zealand spent the least, at around 100 NZ$ while Australians, with more than 1000 NZ$, were the biggest spenders. Australian spending increased steadily to peak at around 2500 NZ$ in 2006 and after some fluctuations, settled at 2000 NZ$ in 2006 which was the highest amongst all countries and much more than the USA which was ranked second with 1200 NZ$. China, on the other hand, peaked in 2000 at 5OO NZ$ and subsequently dropped to approximately 400 NZ$ in 2014 which was the lowest for any country in that year.
The Japanese, in 1996, spent a little less than 500 NZ$, which rose substantially and reached its all-time high of around 1100 NZ$ in 2002. Thereafter, it fell steadily till 2006 to reach almost the same spending as in 1996 i.e. a little less than 500 NZ$. Like Japan, the UK too spent around 500 NZ$ in 1996 but, unlike Japan, by 2014, its tourist spending had grown substantially to almost 800 NZ$.
The above diagram shows the historic and estimated world population growth by region. Summarize the information by selecting and reporting.

Learn how to attempt the bar chart question in IELTS Writing Task 1 and get the best band score!

Find High band sample answers to IELTS Academic Writing Task 1 question that appeared recently.

Find high band sample answers to IELTS Academic Writing Task 1 question that appeared recently.

Find high band sample answers to IELTS Academic Writing Task 1 question that appeared recently.

Find high band sample answers to IELTS Academic Writing Task 1 question that appeared recently.

Find high band sample answers to IELTS Academic Writing Task 1 question that appeared recently.
Learn the right technique to answer multiple graph questions in IELTS Writing Task 1 from our expert IELTS instructor.
Q1 The pie chart represents the browser market share in January, 2018. Prepare a report by summarising the information.
Sample Answer:
The pie chart illustrates the disparity in market share of various internet browsers in January 2018. The browsers considered are Chrome, Internet Explorer, Safari, Firefox and others. Their market share is depicted in percentage and the source of information is statcounter.com.
It is apparent from the pie chart that overall, Chrome was the most preferred of all internet portals, whereas Safari was the least favoured browser.
Chrome captured more than half of the market share in January 2018. Although the share of Chrome v62.0 and Chrome v64.0 was almost similar at 1.4% and 1.3% respectively, and of Chrome v49.0 was 2.16%, Chrome v63.0 dominated the market with 53.02%. Conversely, the Safari v11.0 browser had just 3.39% users.
The second highest number of users was for 'other' browsers at 7.62% followed by Firefox with a market share of 7.36% for v57.0 and 1.02% for v58.0. In comparison, Internet Explorer v11.0 seized approximately 6.2% of the market share, whereas only 2.6% chose to browse through Edge v16.
Q2 The pie charts below show the greenhouse gas emissions for last year by sector for Australia and New Zealand. Summarise the information by selecting and reporting the main features, and make comparisons where relevant.

Sample Answer:
The two pie charts depict sector-wise emissions of greenhouse gases in Australia and New Zealand. The data is in percentages for the last year.
Overall, it is clear that agriculture was the highest contributor to greenhouse gases emilled in both countries
Although waste contributed the least, in Australia, it was double that of New Zealand in New Zealand, agricultural methane and nitrous oxide together produced a whopping 47% of the greenhouse gases whereas in Australia it was marginally lower at 40% but still the highest source. Transport and other energy sources followed with 19%, and 16% of greenhouse gases attributed to these sectors in New Zealand. The picture in Australia was different with transport having a significantly higher production of greenhouse gases at 25% whereas, at 7%, the contribution of other energy was significantly lower.
Interestingly, while the process of electricity generation generated a sizeable 19% of the greenhouse gases in Australia, al 10%, it was just half that in New Zealand Lastly, industrial processes and solvents and waste together accounted for 9% of Australia's greenhouse gases which was almost the same as New Zealand at B.

Learn essential Strategies from our expert instructor to answer Pie Chart Question that one can get in the IELTS Academic Writing Task 1.

Find high band sample answers to IELTS Academic Writing Task 1 question that appeared recently.

Find high band sample answers to IELTS Academic Writing Task 1 question that appeared recently.
Expert advice on writing a Pie Chart Report in IELTS Writing Task for Academic students.
Q1 Analyze the table given below and write a summary of around 150 words.
Sample Answer:
The table illustrates the maximum number of runs scored by six prominent cricketers (SR Tendulkar, RT Ponting, JH Kallis, R Dravid, AN Cook, KC Sangakkara) from across the world, along with the number of matches and individual innings they played.
In general, maximum runs were scored by SR Tendulkar from India whereas the lowest were scored by KC Sangakkara from Sri Lanka. Tendulkar made 15,921 runs by playing 329 innings in 200 matches. On the other hand, Sangakkara made 12,400 runs by playing 233 innings in 134 matches.
Almost similar runs were scored by JH Kallis (13289) from South Africa and R Dravid (13288) from India. There was a difference of only one score. Kallis played 280 innings in 166 matches. Although Dravid played only 164 matches, he managed to score as much by playing more innings.
The second highest scorer was RT Ponting from Australia. He scored 13378 runs by playing 287 innings in 168 matches. Additionally, even though the difference in innings played by AN Cook representing England and KC Sangakkara was 58, each scored approximately 12,400 runs.
Q1 The diagram below shows the changes that have taken place at hotel Paramount, from its year of construction, 1990 to 2020.
Summarize the information by selecting and reporting the main features and make comparisons where relevant. Write at least 150 words.
Sample Answer:
The two maps illustrate significant changes that have occurred at hotel Paramount, over a 30-year period, from 1990 to 2020. The main features in the maps (farmland, forest, restaurant, swimming pool and kid's zone) are presented using different colors.
Overall, the hotel has expanded noticeably in 30-year time by adding three new amenities: a restaurant, a swimming pool and a children's play area. However, this expansion has also resulted in large-scale reduction of forest cover and agricultural land in the area.
In 1990, the hotel was built next to farmland close to a single-lane main road. To the west of the farmland, there was a residential area which included a few houses and to the south was a vast woodland. The hotel also built a car parking area alongside the forest land.
By 2020, the hotel has expanded dramatically. It has cleared most of the forest to increase the parking area. Also, a part of the forest has been supplanted by a swimming pool and a play area for children. Furthermore, the farmland has been reduced to half in order to make way for a small restaurant. Besides, the main road has also been widened to a double-lane road.
Q2 The maps show a road system as it is now and the proposed changes in the future to reduce the number of accidents.

Sample Answer:
The given maps illustrate the existing road system as well as the proposed one, with changes intended to enhance road safety.
It is evident that the major changes proposed include a roundabout, installation of traffic lights and some restructuring of the existing roads
The map of the existing roads clearly indicates that places, where roads intersect, are the major accident-prone areas. To address this problem, it is proposed to install traffic lights at the intersection of City Road and Low Lane. In addition, the construction of a roundabout is planned at the point where City Road and Forest Road cross each other. Moreover, City Road is likely to be straightened to reach the roundabout directly as opposed to the current structure where there is a sharp right angle bend in the road at a specific point, before it reaches Forest Road.
The exit point on City road towards the supermarket is another hotspot for accidents. Hence, it is proposed to have a road leading from the roundabout itself, directly to the supermarket. Lastly, to avoid accidents at the junction where Low Lane meets Forest Road, there are plans to straighten Low Lane

Boost your score with curated IELTS preparation materials featuring sample questions and detailed answers

Find high band sample answers to IELTS Academic Writing Task 1 question that appeared recently.
Q1 The diagram illustrates the different stages of the water cycle. Summarize the information given in the Diagram. Write at least 150 words.

Sample Answer:
The diagram demonstrates the various stages in the natural process of water cycle. It illustrates the cyclic way in which water moves on, above and below the surface of the Earth.
Overall, the process of water cycle has three main stages - evaporation, condensation and precipitation. The process begins with evaporation and ends in precipitation.
Water from large water bodies evaporates in the form of water vapour in the air. Apart from evaporation, heat from the sun causes sublimation of snow and transpiration from plants to add water to air.
This vapour then condenses because of the drop in the temperature to form clouds in a process called condensation. Further, these clouds keep drifting from one place to another with more condensed vapours added to them.
When these clouds get clogged with heavy vapours, they fall back to the earth in the form of rain droplets. This process of turning vapours to water droplets is called precipitation. Thereafter, the rain water finds its way back to water bodies through surface runoff or seeps into the ground after undergoing the natural process of infiltration to complete the cycle.
Q2 The diagram details the process of producing olive oil. Summarise the information by selecting and reporting the main features, and make comparisons where relevant.

Sample Answer:
The diagram illustrates the process of manufacturing olive oil.
Overall, the process commences with the harvesting of olives and culminates in the storage of olive oil for future use.
At the outset, the olives plucked from trees are collected in a vat, post which the leaves are removed and the olives are washed with water Next, the olives are crushed in an olive mill and ground into a paste. This paste then passes through a malaxer in which it is subject to a temperature of not more than 27 °C. Subsequently, the paste is processed in a centrifugal press, the output of which is virgin olive oil. Pomace, a by-product of the centrifugal press process, is collected and transported by truck to refineries for further processing.
Hereafter, a portion of the virgin oil undergoes a separation process and the rest is subject to decantation in the separation process, wastewater is separated from the oil and it is collected in a container while the finished product ie the olive oil moves to the storage tank. Simultaneously, in the decantation process, the solid waste and wastewater, both settle down at the bottom of the decanter while the olive ail gets collected in the storage tank for future use.
Q3 The diagram below shows the present and planned developments in the biomedical campus of a university.

Sample Answer:
The given diagram is a plan of the current and proposed layout of a biomedical campus.
It is evident from the plan that some major changes are being proposed, resulting in a significant reduction in the green cover, more buildings and increased parking area.
The plan reveals that the campus is currently divided into two halves by an East-West road running across it The top half has a car park in the East while the rest is covered with trees. The part to the South of the road is further divided into two halves by a North South walkway. To the right of the walkway are the Genetics and Biotech buildings while the biochemistry department is located immediately to its left. Both halves have a lab each.
In comparison, in the proposed plan, the trees will be replaced by a bioimaging and additional genetics building. Moreover, the existing car park will be reserved for students and an additional triangular-shaped staff car park will be constructed in the lower left-hand corner of the campus. The biotech department will get an additional wing while the biochemistry department will be extended to form a V-shaped building.
Finally, the road dividing the campus into two halves will be removed. Instead, there will be a road running along the entire Western and Southern borders of the campus.
Q4 The plans below show student accommodation buildings 2010 and now. Summarise the information by selecting and reporting the main features, and make comparisons where relevant.

Sample Answer:
The given plans illustrate the layout of student living quarters in the year 2010 and currently.
It is clear that a major part of the garden has been replaced by more essential structures like car parking which was non-existent previously, and student bedrooms, which have increased in number.
In 2010, a substantial garden area was part of the student residence. However, the entire garden adjacent to the main entrance and hallway has now been converted into a parking lot for cars. Likewise a small portion of the garden at the other end of the building and the living room have been replaced by 2 additional bedrooms. As a result, the number of bedrooms which was only 3 in 2010 has now gone up to five Additionally, an en-suite room has been constructed, connected to the student bedroom at the end of the hallway into which the main entrance opens.
In comparison, the bathroom which is at the centre of the student accommodation remains unchanged. Since the living room no longer exists, the kitchen serves the purpose of a social area as well.

Learn all about Academic IELTS Writing Task 1. Practice writing a summary in response to Line Chart, Bar Chart, Pie Chart, Table or Diagram.

Find high band sample answers to IELTS Academic Writing Task 1 question that appeared recently.

Find high band sample answers to IELTS Academic Writing Task 1 question that appeared recently.

Find high band sample answers to IELTS Academic Writing Task 1 question that appeared recently.

Find high band sample answers to IELTS Academic Writing Task 1 question that appeared recently.
Find high band sample answer to IELTS Academic Writing Task 1 question that appeared recently.
Learn the right way to attempt the diagram questions in IELTS Writing task 1 from our IELTS expert.