5 January 2024 IELTS Bar Graph Sample Answer
Looking for recent IELTS questions? Check out our 5 January 2024 IELTS Bar Graph Sample Answer and ace your IELTS with best IELTS online coaching
About the article
This IELTS Academic Question Appeared on 5 January 2024 in India.
Question: The chart below shows the monetary aid from 4 organisations to the developing countries in 4 different years. Summarise the information by selecting and reporting the main features and make comparisons wherever relevant.
Answer:
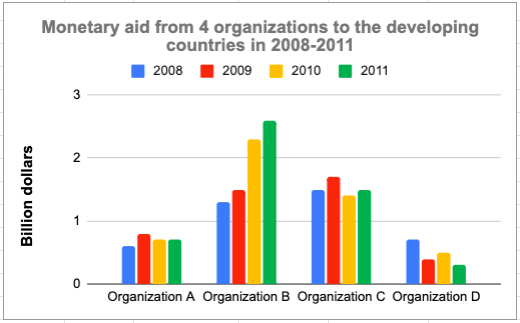
The given bar chart presents a comprehensive overview of the financial contributions made by four different organisations to developing countries over a span of four years, from 2008 to 2011.
Overall, it is evident that Organization B emerged as the most significant contributor, surpassing the others in the total amount of money donated. Conversely, Organization D exhibited the lowest figures, while Organization C's financial support remained relatively stable throughout the observed period.
Breaking down the data, Organization B led the way with an initial contribution of 1.3 billion dollars, which was almost double the amount provided by Organization A. Notably, Organization B experienced a substantial increase, peaking at over 2.5 billion dollars in the final year. Meanwhile, Organization A witnessed a modest rise in financial aid, reaching approximately 1 billion dollars in 2009, and subsequently stabilising at around 0.7 billion dollars in 2010 and 2011.
Further analysis reveals that Organization D allocated around 0.7 billion dollars in 2008, which however dropped significantly to approximately 0.3 billion dollars in 2011. In contrast, Organization C initially donated 1.5 billion dollars in 2008, with subsequent fluctuations between 1.3 and 1.7 billion dollars during the following years.
For more information regarding the IELTS exam, enrol in our live online IELTS classes at Yunolearning.com.